Intro
Most of this post was written many months ago, even before the Valeant (VRX) vs. Allergan (AGN) saga became a national news story. Valeant happens to be a company I reviewed in detail in the past (about 2-3 years ago) and one that I followed closely since then. I first heard of Valeant when the Medicis (MRX) acquisition was announced and, it piqued my interest for the simple reason that I used to work for Medicis in a previous life. This was before I was bit by the value investing bug and dedicated all my energy to the capital markets. I was already long gone by the time the acquisition happened but when the news came out, I thought I should take a look at this company I knew nothing about that apparently was growing by acquiring a bunch of stuff at a dizzying speed.
I never published this write-up for a couple of reasons:
First, as soon as the hostile AGN deal was announced by VRX and Pershing Square, I found every discussions about VRX that I followed, or got involved in, to be quite heated (and a real pain in the behind) as everybody seemed to have a strong opinion about it and very few seemed to be informed about what they were talking about and I frankly didn’t have time to waste getting myself involved, so for the most part I didn’t.
Second, just like many other write-ups I have sitting on my hard drive, it was nothing more than an intellectual exercise for me and a way to hone my analytical skills that was never intended to be published.
However, I recently realized that many investors I know, both personally and internet message board acquaintances (and at this point I think it would be safe to include almost everyone on Wall Street), have allowed themselves to be misguided by the Valeant story telling machine and I feel like I might have failed them by not warning them as I am positive most of them don’t realize the kind of risks they are taking. So I’ve decided to go back on what I said at the beginning of my first and only published write-up about FFH, you know, the part where I said that it would be my first and only published write-up. So what you’re about to read are my original thoughts, accumulated over the years, that I just spent a couple of days updating to account for developments that have transpired over the last few months.
Given the amount of ground that we’ll cover in our analysis (we’ll spend time with Valeant’s 10-Ks, their presentations, and cover their story from as many angles as possible), it is best if I give you a brief overview of what’s to come:
Second, just like many other write-ups I have sitting on my hard drive, it was nothing more than an intellectual exercise for me and a way to hone my analytical skills that was never intended to be published.
However, I recently realized that many investors I know, both personally and internet message board acquaintances (and at this point I think it would be safe to include almost everyone on Wall Street), have allowed themselves to be misguided by the Valeant story telling machine and I feel like I might have failed them by not warning them as I am positive most of them don’t realize the kind of risks they are taking. So I’ve decided to go back on what I said at the beginning of my first and only published write-up about FFH, you know, the part where I said that it would be my first and only published write-up. So what you’re about to read are my original thoughts, accumulated over the years, that I just spent a couple of days updating to account for developments that have transpired over the last few months.
Given the amount of ground that we’ll cover in our analysis (we’ll spend time with Valeant’s 10-Ks, their presentations, and cover their story from as many angles as possible), it is best if I give you a brief overview of what’s to come:
PART I: Extremely Brief Background of the Company
PART II: Valeant's 10-Ks - A Frustrating and Troubling Pattern Towards Opacity
PART III: An Introduction to PowerPoint Investing (or How to Legally Mislead Investors)
PART IV: Unpacking the Valeant Story:
- The Cash Earnings Fallacy
- The Durability Fallacy
- Medicis Case Study
- The IRR Fallacy, the Stuff Crooks Are Made Of and the Synergy Conundrum
- Murky Accounting and Warren Buffett's Cockroach Principle
Part V: Unsolicited Advice From The Desk of AZ Value:
- Delusion of Grandeur and The Expert Fallacy
- Unsolicited Advice from AZ Value to Analysts
- Unsolicited Advice from AZ Value to VRX Shareholders
Conclusion
- Unsolicited Advice from AZ Value to VRX Management
All in all, we’re about to embark on a long journey (a very long one). Mostly because of the sheer amount of information that I have to share, but also because I will use the Valeant story to discuss investing in general and try to highlight some of the major mistakes that, in my humble opinion, investors frequently make. Some of which are glaring mistakes when it comes to Valeant and others that are more subtle but equally harmful nonetheless.
So to make it more palatable for you, dear reader, I've decided to release this long-winded analysis in 3 separate installments. The first of which is this very post you're currently reading, it should take us all the way through Part III where we'll take our first look at the dangers of relying on management presentations for analysis.
Hopefully I’ll manage to keep it entertaining as well as informative.
Alright, enough with the intro, let’s get started.
I’m going to assume that the vast majority of those interested in reading about Valeant have, at the very least, an overall understanding of their history. So I won’t waste too much of your time going over it again. I will spend enough time analyzing various aspects of their story in deeper details throughout the write-up. For the rest of you, here’s the 30 second elevator pitch version of the VRX story in bullet point form:
________________________________________
PART I: Extremely Brief Background of the Company
I’m going to assume that the vast majority of those interested in reading about Valeant have, at the very least, an overall understanding of their history. So I won’t waste too much of your time going over it again. I will spend enough time analyzing various aspects of their story in deeper details throughout the write-up. For the rest of you, here’s the 30 second elevator pitch version of the VRX story in bullet point form:
- February 2008: Valeant (still a California based company at the time) hires Michael Pearson as CEO.
- Company has engaged in dozens (well over a hundred) of M&A deals at a dizzying speed since Pearson took over.
- June 2010: Merger with Canadian company Biovail.
- This merger created the Valeant that we know today, a big part of that being a more favorable tax structure for the combined entity.
- Valeant has a modus operandi as far as how a pharma company should be run that can be summarized as follows:
- Pharma companies spend too much money on low return R&D so Valeant cuts all the R&D spending of companies they acquire to the bone.
- They also claim that, unlike other pharma companies, they have what they call “durable products”. The thinking being that this allows them to not need to spend on R&D as things like patent cliffs don’t affect them.
- Valeant also cuts costs heavily in their acquisitions as they often go into a deal promising significant synergies and the restructuring/integration costs incurred have been significant to date.
- As a result of their acquisition spree, Valeant has grown considerably in recent years, going from $1B in revenue in 2010 to about $8B in 2014.
- However, those acquisitions were mostly made using debt as the company’s debt load went from nearly nothing when Pearson took over to over $17B in 2013, which is a red flags that Valeant bears often point out (a legitimate one in my view).
- After dropping to $15B in 2014, the debt load just doubled to $30B+ with their latest acquisition in early 2015.
________________________________________________
PART II: Valeant's 10-Ks - A Frustrating and Troubling Pattern towards Opacity
Alright folks, now that introductions are out of the way, let’s get into the serious stuff and begin analyzing this company through the eyes of your friend AZ Value.
The most obvious as well as most talked about aspect of Valeant, is its highly acquisitive nature. Engaging in dozens and dozens of M&A deals, in what seems like the blink of an eye, is just not that common, and quite frankly is something one should watch carefully as it might be a red flag. This, of course, has led many people to levy the accusation that Valeant is nothing more than a dangerous roll-up that needs to keep acquiring bigger and bigger targets in order to hide the underlying fundamentals of their business and deliver the growth they promise the Street.
So this aspect of their story is where any analyst worth his salt should start. Put simply, when analyzing a serial acquirer, your first and most important job as an analyst should always be to get a sense of how those acquisitions are performing once they’re rolled into the parent company.
In my world, analyzing a company always starts and ends with their 10-Ks. They are, for the most part, the only place where you can find a company’s unbiased story being told by their operational performance, so that’s where we’ll begin. We’ll focus our attention on the 2011 and subsequent 10-Ks because prior to the Biovail merger, Valeant wasn’t the same company we’re looking at now and Michael Pearson and his team weren’t calling the shots at Biovail.
Valeant’s most important acquisitions during 2011 are summarized in the table below (the myriad of small ones they do are just not material for our purpose):
So this aspect of their story is where any analyst worth his salt should start. Put simply, when analyzing a serial acquirer, your first and most important job as an analyst should always be to get a sense of how those acquisitions are performing once they’re rolled into the parent company.
In my world, analyzing a company always starts and ends with their 10-Ks. They are, for the most part, the only place where you can find a company’s unbiased story being told by their operational performance, so that’s where we’ll begin. We’ll focus our attention on the 2011 and subsequent 10-Ks because prior to the Biovail merger, Valeant wasn’t the same company we’re looking at now and Michael Pearson and his team weren’t calling the shots at Biovail.
Valeant’s most important acquisitions during 2011 are summarized in the table below (the myriad of small ones they do are just not material for our purpose):

(You can click on pictures to make them larger for easier reading)

Let’s use the Sanitas acquisition that I emphasized above to illustrate why I’m showing you this.
I always read annual reports with a notebook next to me that I use to take notes about what I deem to be important stuff for my analysis. In this disclosure, we’re told that Sanitas generated $49.6M in sales after the deal was closed. So to give you an idea here’s what my notes actually looked like:
Until now all is fine. It’s just the beginning of the analysis of course, but it’s really as simple as that. From there, one would do the same for all the major acquisitions and try to track them the following year and hopefully begin to paint a picture of how well they are performing under VRX.
Next on the agenda is to move to the 2012 annual report to do the same analysis. Unfortunately, as I’m about to show you, the real Valeant begins to show its true face very quickly. And it ain’t pretty. See the same MD&A disclosure for 2012 below:
I always read annual reports with a notebook next to me that I use to take notes about what I deem to be important stuff for my analysis. In this disclosure, we’re told that Sanitas generated $49.6M in sales after the deal was closed. So to give you an idea here’s what my notes actually looked like:
Sanitas Acquisition Date: 8/19/11 => 134 days under VRX => 134/365 = 37%With that, I have a very rough guesstimate of what kind of revenue Sanitas would potentially bring in on an annual basis. And from there I can then look for clues about what margins Sanitas generates, what synergies might come with the deal etc. to get an idea of cash flows and profitability to round up my analysis.
Est. annualized Sanitas revenue = $49.6/37% = $135M
Until now all is fine. It’s just the beginning of the analysis of course, but it’s really as simple as that. From there, one would do the same for all the major acquisitions and try to track them the following year and hopefully begin to paint a picture of how well they are performing under VRX.
Next on the agenda is to move to the 2012 annual report to do the same analysis. Unfortunately, as I’m about to show you, the real Valeant begins to show its true face very quickly. And it ain’t pretty. See the same MD&A disclosure for 2012 below:

I’m sure many of you immediately caught the problem.
It’s a small change but one that impacts our analysis quite significantly. VRX suddenly decided in 2012 that they would not breakout the revenue numbers for major acquisitions, essentially making it impossible for me to run the same back of the envelope analysis I showed you for Sanitas in 2011. The numbers are now given as a total of $709M for 2011 deals and $281M for 2012 deals.
What really annoys me is that I can’t figure out a reason for this. I understand that companies change their disclosures over time as their business evolves, but there literally isn't any reason at all to suddenly decide not to give the same disclosures as the prior year. It’s not like the number of big acquisitions increased to a level that would make it impractical to give the same level of detail. Here is a summary of the main 2012 acquisitions:

Again, I really can’t find a viable explanation as to why they would suddenly change their disclosures like that, but I’ll tell you what the change accomplishes though, it makes life much harder for someone like AZ Value, who is sitting at home trying to analyze the company; it is suddenly much harder for me to track their acquisitions individually and VRX management knows that.
Mandatory reminder: With a highly acquisitive company, we have to be able to verify how those acquisitions are actually performing, any analysis that doesn’t do that doesn’t deserve to call itself fundamental.
Now, with that being said, luckily for me, I happen to know my way around 10-Ks a bit and I know that if one keeps reading past the MD&A and into the notes to the audited financial statements, there is a disclosure in there that will talk about business combinations and since I’ve read the 2011 10-K thoroughly, I know that sales figures were disclosed in that footnote.
For instance, this bit of info below disclosed in that footnote in 2011 under the Sanitas section would essentially have done the trick for the rough guesstimate we performed earlier:

With that in mind, I shouldn't get too worked up about the change in MD&A disclosures since I ought to be able to open up the 2012 10-K and just look for updated info in that footnote to track Sanitas. At least that’s what one would hope, right?
Well, think again, because when it comes to disclosing how much revenue their acquisitions bring in, that’s just not how VRX works. There still is a Sanitas section carried over from the 2011 annual report for sure, but the revenue info I just showed you above has disappeared. They just choose to take it out once they move to a new year for every acquisition. It’s simply gone. So all I’m left with is the knowledge that in the few months post acquisition in 2011, Sanitas brought in roughly $50M, but after that, nothing, your guess is as good as mine as it goes totally opaque.
Let me take a brief moment here to open a parenthesis, so we can talk big picture for a second (we’ll be doing a few of these, so get used to them).
Folks, for those of us who are users of financial statements, there is an extremely important concept that we all rely on to analyze companies. The concept in question is the sequential nature of financial disclosures, it is the reason why we constantly read disclosures in 10-Ks with sentences like:
Company XYZ did such and such for a total of X amount and Y amount in 2013 and 2012 respectively.And one would hope that the principle and accounting behind the sequential numbers disclosed stay consistent enough so that you can effectively operate a year over year comparison. Although we all probably take it for granted, I can guarantee you that, just like the air you breathe, the moment it’s taken away from you, you’re quickly reminded how crucial that concept is.
Now, let’s actually go hands on to fully illustrate this point using Medicis as an example this time. Here’s the 2012 VRX annual report, go ahead and open it: Valeant 2012 Annual Report
Next, go straight to page 146 – This is page 146 of the pdf document, the annual report page number at the bottom will read “F-24”.
What you see, at the bottom of the page under “Revenue and Net Loss of Medicis”, is similar to the Sanitas one I showed you earlier. It’s important to note that the Medicis acquisition was completed on December 11 2012, so the $51.2M in revenue you see there is only for about 3 weeks under Valeant ownership. That is pretty much meaningless and useless, we can’t tell anything about the performance of Medicis under Valeant from that small a sample. And please keep in mind, I cannot emphasize this enough, being able to analyze how it is performing is the main goal here, especially since Medicis was Valeant’s biggest acquisition to date at that time.
Let’s move to the 2013 annual report to take a look: Valeant 2013 Annual Report
Now go to page 151 of the document (the annual report page will read “F-31” at the bottom).
What you see, right above “OraPharma” is the end of the Medicis disclosure. The revenue section that was there the previous year is simply gone. Presumably, if they had wanted to keep in the same info as 2012, they would have been asked to also disclose 2013 revenues alongside the $51.2M for 2012 to make sure that readers are provided with sequential comparative numbers, instead of doing that they just took it out. And this happens for every single acquisition they make!
Also noteworthy is that the threshold for them to even disclose the revenue numbers in the first year of acquisition seems to go up every year. While they gave us individual details for nearly all big acquisitions in 2011, in 2012 we only get Medicis and OraPharma and in 2013 we only get Bausch & Lomb even though they had other deals worth hundreds of millions of dollars individually. All those other deals are bundled under one heading making it impossible to tell them apart. So, if you’re lucky enough to even get that information for one of their acquisitions, you only get it for the few months that they own it during the first year and then it disappears.
And there is no need to ask management directly about it as you will be told some generic stuff like:
"Well, we work with our auditors and our board every year to make sure all our disclosures are appropriate and completely transparent, in fact we go above and beyond that"I have no doubt they can come up with a justification as to why revenue numbers suddenly disappeared, but whatever they might tell you is completely irrelevant to you and I as analysts. Only the two following facts matter:
- Is it information that one needs? Yes. One cannot perform a detailed review of an acquisitive company like VRX if zero visibility is provided into their performance post acquisition.
- Is it information that the company can easily provide? Of course it is. This is nothing more than revenue numbers, why wouldn’t they want to provide them one might wonder. In fact all we need is that they don’t suddenly change MD&A disclosures, bundling all acquisitions together, and we’d be happy with that. They were already providing that information!
Why am I mentioning this? Well, simply because we have to be resourceful and find a way to work around the roadblocks that we’re running into in our attempt at analyzing this company. One of those ways I would use involves this table:

This table shows the changes that VRX made to its operating/reporting segments over the last few years. I’ve seen others, including Allergan in one of their presentations, point out this gradual narrowing as one of the tools Valeant has used to throw mud in the water for those trying to analyze the company, and I agree with that. Let me tell you why that is so.
Even if Valeant didn’t want to disclose sales numbers, as you got to know the company, you realized that their various segments were driven by just a few main products. For instance, their Neurology segment was mostly Wellbutrin sales, and their Dermatology segment was Acanya sales to which Retin-A sales were added with the Ortho acquisition, Solodyn with the Medicis acquisition etc. One could kind of track very roughly how those were doing with the segment disclosures and the answers they had to give to analysts regarding each segment during conference calls. And obviously you can tell what happens there at the end right?
Like I said earlier, it’s important to always know that changes are not inherently a bad thing, as long as they’re justified. Businesses evolve and everything about them has to evolve too. So before we pass any judgment we have to see what prompted the VRX management to decide to rearrange their reporting segments under “Developed” and “Emerging” markets.
Here’s the justification given in the 10-K:
“As a result of our acquisition strategy and continued growth, impacted by the December 2012 Medicis acquisition, our Chief Executive Officer (“CEO”), who is our Chief Operating Decision Maker (“CODM”), began to manage the business differently, which necessitated a realignment of the segment structure, effective in the first quarter of 2013. Pursuant to this change, we now have two operating and reportable segments: (i) Developed Markets, and (ii) Emerging Markets.”Now, let me tell you one thing, there are very few things that I am 100% certain about in life, beyond the usual death and taxes being guaranteed type of stuff.
Fortunately for us, two of those things happen to be that Medicis was:
- A dermatology company,
- Almost all their sales were US sales. Non-US sales were minimal, mostly to Canada.
You see folks, there is a word in the English language used to describe what I just showed you. That word is “pattern”. I quite frankly do not believe it to be a coincidence that nearly all reporting changes implemented by Valeant somehow result in less transparency. It is of course by design that it is so.
Now, we’ve officially reached the point of total opacity as far as 10-K analysis and all you can do is rely on conference calls where analysts asking Mr. Pearson and his team questions like:
So what does all this mean for us users of those financial statements? Does it mean that Valeant just gets away with it? Gets to never say a word about revenues of their acquisitions and all is well? I’m sure Valeant would love that, but of course not, it’s not that simple. Analysts covering Valeant will surely ask questions so they have to find a way to provide answers somehow.
Which leads us to Part III of our analysis, an introduction to something that I like to call “PowerPoint Investing”.
Alright, since 10-Ks weren’t of much help, let’s turn our attention to the preferred method of communication for the vast majority of management teams out there, i.e. investor presentations.
Let me start off by showing you the PowerPoint slides that Valeant used to replace the revenue disclosures that are missing in their SEC filings. Take a few seconds to review and get familiar with them then keep reading, we’ll analyze them together afterwards.
Analyst X: “Mike, I was wondering if you could give us more color on the Solodyn sales, our data shows a pretty significant drop since you acquired Medicis, any color on that?”
Mike Pearson: “Well, actually, we’re pretty satisfied with the progress, we think we’ve stabilized it and we like the current trend.”This gibberish means nothing to me at all. If you are satisfied with a current trend, then just give us numbers so we can rejoice with you, if not then your words don’t mean much. Especially since all other pharma companies never had any issue giving detailed numbers.
So what does all this mean for us users of those financial statements? Does it mean that Valeant just gets away with it? Gets to never say a word about revenues of their acquisitions and all is well? I’m sure Valeant would love that, but of course not, it’s not that simple. Analysts covering Valeant will surely ask questions so they have to find a way to provide answers somehow.
Which leads us to Part III of our analysis, an introduction to something that I like to call “PowerPoint Investing”.
________________________________________________
PART III: An Introduction to PowerPoint Investing (or How to Legally Mislead Investors)
Let me start off by showing you the PowerPoint slides that Valeant used to replace the revenue disclosures that are missing in their SEC filings. Take a few seconds to review and get familiar with them then keep reading, we’ll analyze them together afterwards.
2011 Q3 conference call presentation:

2012 Q3 conference call presentation:

2013 Q2 conference call presentation:

Let’s put these aside for a minute so we can talk about life and investing first.
To tell you the truth, I spent quite some time thinking about how to approach this section. Not because it was hard to debunk the misleading info that Valeant is sharing in these slides, I did that part in a matter of minutes. No, it was because I was surprised to see that many investors (very smart people for the most part), were sharing these slides either with me directly or passing them around on Twitter or various message boards as proof of how well Valeant was doing with its acquisitions.
At first I thought I would spend some time explaining why so many people seem to be easily fooled by Valeant presentations, and go into the psychological biases that are the reason why even very smart people can condition themselves into missing obvious stuff, especially when they “fall in love with a story”, which seems to always be the case with companies like Valeant.
But I decided that it was a topic better left for another time because getting into it would take too much time and it would require that, among other things, I share with you the content of what I consider to be the single most important item sitting on my bookshelf out of the dozens and dozens of books you can find there. It’s a binder I’ve been putting together for a little while now, and to which I make sure to add pages every year. I call it “Charlie Munger and Danny Kahneman on Human Biases”. Maybe I’ll write a piece about that specific topic one of these days (I wouldn't count on it but who knows).
For now, before we get back to Valeant, I’ll just leave you with the advice I give to any beginning value investor (at least those that are foolish enough to listen to me).
First I tell them they should spend maybe a year or two studying Buffett and Graham and all the people that will teach you what fundamental analysis entails. Either they’ll get the core principles of value investing immediately or they won’t, anything beyond that and all they’ll see is an army of parrots that travel the world repeating the same Buffett quotes ad nauseam;
But I decided that it was a topic better left for another time because getting into it would take too much time and it would require that, among other things, I share with you the content of what I consider to be the single most important item sitting on my bookshelf out of the dozens and dozens of books you can find there. It’s a binder I’ve been putting together for a little while now, and to which I make sure to add pages every year. I call it “Charlie Munger and Danny Kahneman on Human Biases”. Maybe I’ll write a piece about that specific topic one of these days (I wouldn't count on it but who knows).
For now, before we get back to Valeant, I’ll just leave you with the advice I give to any beginning value investor (at least those that are foolish enough to listen to me).
First I tell them they should spend maybe a year or two studying Buffett and Graham and all the people that will teach you what fundamental analysis entails. Either they’ll get the core principles of value investing immediately or they won’t, anything beyond that and all they’ll see is an army of parrots that travel the world repeating the same Buffett quotes ad nauseam;
Second, equally as important (if not more), I tell them that they should then spend the rest of their lives studying and drawing conclusions from the teachings of people like Munger, Kahneman or Bob Cialdini, because overperformance or underperformance in investing generally stems from mental lapses; it is rarely due to the fact that one analyst can run a DCF model better than another. Often times when people lose money, because they invested in a grossly overvalued company for instance, they know very well that the company is overvalued, and yet they manage to talk themselves into buying it regardless, because “this time it’s different”.
A good place to start is this famous speech called “The Psychology of Human Misjudgment” given by Munger at Harvard University in 1995 https://www.youtube.com/watch?v=pqzcCfUglws – If you go through all the biases he describes in there and make it a point to design a system that would allow you to avoid them as much as possible, I can guarantee that you will be a much better investor over time. But do that another day, we have an analysis to get back to.
Alright, enough waxing philosophical, let’s jump back into our analysis. Let me first bring back the 2013 slide from above:

Here’s Mr. Pearson’s commentary on this slide, copied verbatim from the conference call transcript:
“As most of you are aware, once a year, Valeant overviews the performance of past acquisitions with our Board of Directors and our investors, reviewing key metrics to evaluate the success of our transactions. On the next 2 slides, we have analyzed all acquisitions that were over $75 million in purchase price and completed since 2008. As you can see, each of our acquisitions is performing extremely well as compared to the revenue forecasted in the original deal model with the exception of Afexa. Fortunately, Afexa and in particular, COLD-FX has rebounded dramatically in 2013. And from a cash flow standpoint, Afexa is now on track as compared to our deal model. I would also like to note the strong performance of Biovail, Sanitas, PharmaSwiss and iNova, which are among the largest transactions over the last 5 years. In aggregate, our acquisitions have grown organically at 12% compound annual growth rate.”
Seems like what he’s saying/showing makes sense. But it doesn't.
The first time I took a look at this slide, within seconds, my own “inner commentary voice” whispered something like this to my ear in its typical sarcastic tone:
“Look at that, you’re a $50 billion company with stated goals of becoming a $150 billion dollar company and you want me to look at how fast that 60 million bucks is growing? That’s adorable, how about we talk about the $1.3 billion that is declining instead?”After one look at that table it was clear to me that, for the numbers above to make sense, the 12% aggregate growth rate had to be the average of the growth rates above, and that is misleading. Here’s a tip that hopefully will make your life easier in the future:
Among the many arrows that one has to keep in his analysis quiver at all times, are the simplest and most basic rules that govern the world of mathematics. The key, however, is to be mindful that one has to constantly apply them. And here we have an example of one of those simple rules which is: Things like growth and averages are always driven by size.
So next time someone shows you a table like this that is obviously directing your attention towards an aggregate growth number, always remember that you can quickly test it for reasonableness by going up the list and mentally testing the big numbers against the growth number you’re given. If they are significantly off, you should take a minute and investigate further.
So next time someone shows you a table like this that is obviously directing your attention towards an aggregate growth number, always remember that you can quickly test it for reasonableness by going up the list and mentally testing the big numbers against the growth number you’re given. If they are significantly off, you should take a minute and investigate further.
If anyone is still not sure what I’m getting at, let me give you an easy widget example:
Say there’s a company, we’ll call it AZ Value Inc., and it sells two products, widget A and widget B, with sales of $900 and $100 respectively, for a total of $1000 in year 1. In year 2, widget A sales drop 10% to $810 and widget B sales increase 30% to $130. Now AZ Value Inc. has $940 in total sales. Here’s a summary:
Say there’s a company, we’ll call it AZ Value Inc., and it sells two products, widget A and widget B, with sales of $900 and $100 respectively, for a total of $1000 in year 1. In year 2, widget A sales drop 10% to $810 and widget B sales increase 30% to $130. Now AZ Value Inc. has $940 in total sales. Here’s a summary:

Now, if you were to average the -10% and 30% growth rates you’d get an average of 10%. But would you say that AZ Value Inc. as a whole grew by 10% from year 1 to year 2? Of course not. The correct way to look at this is to compute a weighted growth rate:

Obviously this is the correct answer because to go from $1,000 to $940, sales declined by 6% as opposed to growing by 10% “on average”.
If you go back to the VRX slide, you can very easily run the same brief mental test I ran the first time I saw that table to determine if 12% is reasonable. Just identify the big numbers under 2013 forecast, you’ll notice that between the two of them, Biovail and Medicis account for nearly half of the total amount and they’re either not growing or actually declining. And if you look at the deals that follow Biovail and Medicis in size, you’ll see that Pharmaswiss, Inova and Dermik are all either below 12% or also declining. And by now you’ve blown way past 50% of the total amount. In short, just like that, in about 10 seconds anyone can see that the 12% makes no sense. And if you were to take all the CAGR numbers and average them, you’d get the 12% we’re given. When a more correct representation of the overall growth would look like this:

Anyone reading this can of course test this, all you have to do is grow the 2013 sales numbers of each acquisition one more year using the CAGR provided by Valeant and see if the $3,249 total has grown by 6% or by the 12% they’re telling us. And if you’re wondering whether the Valeant folks are aware of this difference, of course they are. It’s like asking me if I’m aware that AZ Value Inc. made $940 and not $1,100 in year 2 of our widget example.
And just like that, in a matter of minutes we just cut the growth rate they were claiming in that 2013 table by half. Pretty cool isn’t it? Guess what? We’re just getting started, because I don’t believe that 6% either.
Alright, let’s move from how the information is presented to us to the actual content of the slides.
In my opinion, the key difference maker in good fundamental analysis is effort. It’s always nice to bring that extra bit of IQ or skillset to the table, but really it’s all about the effort you put in. I’ve been in situations where I had to sit on my behind and read hundreds of pages of disclosures to find one little piece of valuable information buried in a footnote that not many people had taken the time to read, and that just boils down to whether you’re willing to spend that much time reading boring disclosures or not, because nearly everybody is capable of doing it, but almost no one is willing to do it.
Unfortunately, one thing that makes analyzing Valeant very tough is that the overwhelming majority of their acquisitions are private companies with no reported numbers before being bought by VRX. As we saw in Part I, even for prior public companies you will probably only have historical numbers as Valeant refuses to divulge any information in their 10-Ks once they are acquired. Regardless, you still have to do it, you still have to go and read past annual reports of the companies they’ve acquired, if you can find them, to get a sense of what it is they are buying (at least, I know I did).
With that being said, it seems as if every now and then, the Investing Gods reward your previous efforts by making it as easy as this: http://lmgtfy.com/?q=Sanitas+AB.
Yes, this time it really was as easy as using Google to run a search for “Sanitas”. If you think back to our part I, there is a reason why I chose to use Sanitas for my example when we were analyzing Valeant’s 10-Ks. I wanted to get everybody used to that name because it will play an important role in our analysis, a very important role.
With that being said, it seems as if every now and then, the Investing Gods reward your previous efforts by making it as easy as this: http://lmgtfy.com/?q=Sanitas+AB.
Yes, this time it really was as easy as using Google to run a search for “Sanitas”. If you think back to our part I, there is a reason why I chose to use Sanitas for my example when we were analyzing Valeant’s 10-Ks. I wanted to get everybody used to that name because it will play an important role in our analysis, a very important role.
Brief overview:
Sanitas is a Lithuanian company that, before being acquired by Valeant in August 2011, was publically traded on the Vilnius Stock Exchange (technically called The NASDAQ OMX Vilnius if anyone is wondering). Even though Valeant’s management will swear that it is a rare gem – like they always do for anything they acquire – there is absolutely nothing special about Sanitas, it’s anywhere between a barely OK to a crappy European pharma company selling generics and branded generics in the Central and Eastern European region (most of their sales are in Poland). Actually, there is one unique aspect about Sanitas. When I went to look at their website hoping that maybe there would be something useful to be found there, I noticed something unusual on the investor relations page where they publish all their interim and annual reports.
Right there, staring back at me, were annual reports for both 2011 and 2012 available for download. At first I thought it was a mistake and didn’t believe it myself. How could this be possible? Sanitas was acquired by Valeant in August 2011. Why in the world would they file 2011 and 2012 annual reports?
Well, first things first, I had to cover the basics:
As for why they filed those annual reports, as far as I can tell the answer has to do with ownership of shares. VRX first negotiated the acquisition with all the funds that were major shareholders in Sanitas to buy roughly 90% of all the shares outstanding. After that they were allowed to initiate a mandatory tender offer or “squeeze-out” of the remaining shareholders, which they did. But for some reason a tiny portion of the shareholders (0.6% to be exact) held out in 2011, which presumably meant that, under their rules, they still had to file audited financial statements because the company wasn’t 100% private. The following two tables are from Sanitas’ 2011 and 2012 annual reports:
- Were they audited? Yes, Deloitte was their auditor prior to the acquisition but PriceWaterHouseCoopers, being Valeant’s auditor, signed off on both 2011 and 2012 financials, albeit they issued qualified opinions. The opinions were qualified for a couple of items that don’t really affect our analysis but any investor should read them anyways.
- Were they translated into English? Also a yes. (Thank God!).
As for why they filed those annual reports, as far as I can tell the answer has to do with ownership of shares. VRX first negotiated the acquisition with all the funds that were major shareholders in Sanitas to buy roughly 90% of all the shares outstanding. After that they were allowed to initiate a mandatory tender offer or “squeeze-out” of the remaining shareholders, which they did. But for some reason a tiny portion of the shareholders (0.6% to be exact) held out in 2011, which presumably meant that, under their rules, they still had to file audited financial statements because the company wasn’t 100% private. The following two tables are from Sanitas’ 2011 and 2012 annual reports:

And surprisingly, they went the whole of 2012 with that tiny 0.6% still outstanding:
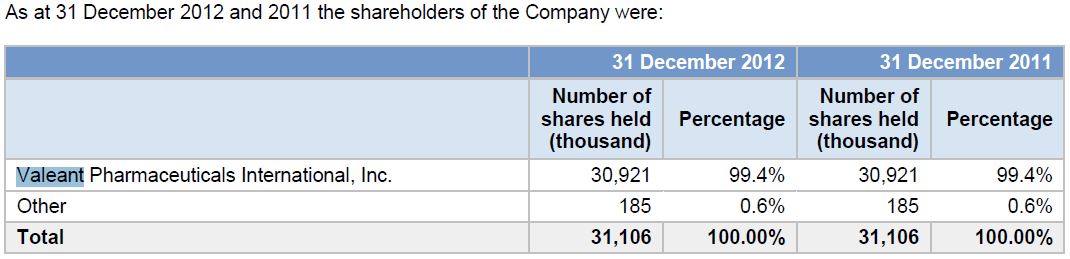
It wasn't until after Q1 2013 that Sanitas stopped reporting, presumably because Valeant finally bought out the remaining shareholders. So like I said earlier, sometimes the Investing Gods will throw you a bone and hold out 0.6% of a mandatory tender offer in order for you to have actual numbers to use in your analysis.
Before we jump back into the numbers, let me add one last thought to illustrate my little rant about effort from a few paragraphs ago. You see, Sanitas’ financials were in their local currency, the Lithuanian Lita, which meant that once I got my hands on them I had to manually transpose years of those financials into Excel and convert them into USD to analyze them. It’s not that it’s a hard thing to do, getting average exchange rates for the income statement and spot rates for the balance sheet is very easy. It just takes a little bit of effort.
Fast forward many months after that, I found myself using Capital IQ for the very first time to look up a company I was reviewing when the thought came to me that I should run a search for Sanitas and see what comes up. To my surprise the 2011 and 2012 numbers were available for anybody to look at. Already converted into USD and everything. The point I’m trying to make here is that all this information was always a few clicks away for everybody with this kind of access. As a matter of fact you can fire up your Bloomberg terminals or log into your Capital IQ account right now and run that search and you will find all the Sanitas financials and annual reports I’m talking about. And yet I haven’t seen anyone, not a soul, bringing this up as a way to at least make an attempt to check the veracity of some of the numbers VRX has fed analysts over the years, while I, on the other hand, had to (figuratively) go to Vilnius - Lithuania to find it.
Right now we’re about to do a very brief check on basic top line revenue numbers, but later in the analysis I will show you how this information can be used in a much more damning way to disprove Valeant claims (so stay tuned). The key point here, again, is that analysts at big funds or big firms that publish sell side reports always had access to information that I personally didn’t and yet they somehow never used it. This, in a nutshell, is exhibit A for why the Efficient Market Hypothesis is an asinine concept.
Alright, back to the numbers. Here are Satinas’ actual revenue numbers for the 5 years 2008 – 2012:

And if we compare these numbers to those provided by Valeant:
2011 sales per Valeant: $147M. That’s a pretty big difference from the actual of $125M, almost 20% off.
2012 sales per Valeant: $144M. Again, a pretty big difference compared to the $128M actual sales numbers.
So at the very least we know for a fact that, as far as Sanitas is concerned, the numbers those slides are providing us are constantly higher than the actuals. Not exactly in line with how Valeant always says that they are conservative with all their forecasts, hence why they always beat them. Also noteworthy is the fact that the 2011 and 2012 estimates were given on November 3rd and November 2nd respectively so having a 20% discrepancy with less than 2 months to go to close the year is almost impossible in an industry where companies are supposed to constantly be on top of what is in the channel because products have to be manufactured ahead of time.
Of course if you’re really thorough you could also go back to the time of the acquisition to look at what Valeant was saying about Sanitas to compare it to reality. Little excerpt from this (http://prn.to/1I7P0Ft) news release announcing the deal:
"Annual revenues for Sanitas are expected to be over EUR100 million in 2011, with an approximate revenue growth rate in the low double digits over the coming years.”The expected €100M revenue would have been around $140M when converted into dollars which is still above actual revenues but more importantly and more telling to me is the little blurb where they claim double digits revenue growth in the coming years (this is a recurring theme with Valeant as we’ll see a lot during our analysis). I don’t know about you but there is nothing about those sales numbers from 2008 to 2012 that says double digit growth to me.
Alright, let’s put Sanitas aside for now, we’ll get back to it later I promise.
Let’s say you didn’t go through the effort of finding Sanitas’ financials to get actual audited numbers you can compare with the VRX slides. Well, in my eyes, if you’re an analyst paid to analyze VRX, you still don’t get a pass. Analysts shouldn't just buy everything they’re shown without even trying to independently verify whether or not it makes sense. And there are many ways to do that just using common sense. Let me give you an easy example of how I would think through whether what I’m being shown is reasonable or not:
Let’s use the Medicis numbers that we’re given in the 2013 slide. We’re told that Medicis sales grew from $745M to $753M.
One key historical fact about Medicis to be aware of is that 50% to 60% of all the money that they brought in was from sales of their acne drug Solodyn. Here are tables from analyst reports on Medicis published right before the completion of the acquisition that give us historical sales (focus on the Solodyn line item):
One key historical fact about Medicis to be aware of is that 50% to 60% of all the money that they brought in was from sales of their acne drug Solodyn. Here are tables from analyst reports on Medicis published right before the completion of the acquisition that give us historical sales (focus on the Solodyn line item):
Deutsche Bank report published: 08/09/2012

JP Morgan Report published: 08/09/2012

RBC Capital Markets report published: 08/09/2012

As a reminder, the Medicis acquisition was closed in December 2012.
In 2011, all 3 analysts had Solodyn sales at roughly $370M. Their estimates for 2012 sales ranged from $322M to $330M and for 2013 the average of the 3 estimates was $358M and sales were expected to rise thereafter.
Well, in 2013 as soon as Valeant acquired Medicis, Solodyn sales began collapsing pretty rapidly. Here are a few excerpts from various VRX conference calls throughout 2013:
2013 guidance conference call on 1/4/2013:
“(…) We are also projecting SOLODYN sales of $250 million to $275 million in 2013, and we believe this is a conservative assumption. (…)” – Howard Schiller
“(…) When we mentioned or when we talked about when we acquired Medicis, we talked about taking a very conservative approach to the revenues and the forecast, and so we continue to do so with SOLODYN. As Howard mentioned, we would hope to beat those numbers, but we thought it was useful for our investors to know what were -- what was the basis of SOLODYN revenues that we included in the budgeting process we went through. So again, we would hope that over the course of the year that would prove to be conservative. (…)” – Michael PearsonJP Morgan Healthcare Conference on 1/8/2013:
“(…) As we mentioned last week, we've included $250 million to $275 million for SOLODYN, which we believe is conservative. (…)” – Howard Schiller
Q1 2013 Earnings Call on 5-2-2013:
“The other brands that are showing on the slide are Ziana and Solodyn, which are performing at budget, and Zyclara, which is performing behind budget.”– Michael PearsonGoldman Sachs Annual Global Healthcare Conference on 6-11-2013:
“(…) I'd say Solodyn and Ziana are running according to plan. (…)” – Howard SchillerQ2 2013 Earnings Call on 8-7-2013:
“(…) Just a couple of product-specific questions. Just first on Solodyn, what's your level of confidence that you can return that to a meaningful growth? Or should we be thinking of that asset as something where you'd probably wind down promotion on as we get closer to generic entrants in 2018 and 2019? (…)” – Question by David Amsellem, Piper Jaffray Companies
“Now Solodyn has been an important product for us. And we will continue to promote Solodyn. It's promotionally sensitive, stabilized at this point and [indiscernible] a lot of money for us. And it's one of our largest, if not probably our largest product. And so we're not going to be backing off on Solodyn. And in fact, the recent trends are positives. (…)” – Michael PearsonAnd suddenly in Q3, the truth begins to come out:
Q3 2013 Earnings Call on 10-31-13:
“(…) Solodyn, while seeing some erosion this year, appears to have stabilized at roughly $200 million on an annualized level. (…)” – Michael Pearson
“(…) And on Solodyn, you talked about $200 million for stabilization level, earlier in the year I think you got into high 200s or mid to high 200s. Is there still some price flexibility there, or there other things you're doing to still achieve that given that, that may be the most important asset that came with Medicis?” – Question by Gregory B. Gilbert, B of A Merrill Lynch
“(…) This relates to Solodyn, I believe we said originally it would be about $250 million. We're clearly seeing some erosion. We believe it's been stabilized. We're exploring opportunities to continue to grow that. (…)” – Howard Schiller
Alright, let’s recap what we've just learned about Medicis and Solodyn during 2013.
So the year began with Valeant “conservatively” forecasting Solodyn sales of $250M to $275M. Before we go any further I’d like to point out that even the high end of that estimate is about 17% below 2012 sales and 24% below the 2013 sales that were projected by analysts following Medicis.
And then they went on to spend more than half the year saying that Solodyn was performing in line with their budget before eventually admitting that it had been far below that and “stabilized” around $200M. Again, that final $200M level would be about $130M below 2012 sales or a 40% drop and $158M below 2013 sales that were projected by analysts.
Add to that other facts like another important Medicis product, Vanos, going generic in 2013 or another one like Zyclara that came with Medicis acquiring Graceway before the Valeant deal being “behind budget” according to them and all this leads me to ask this simple question:
How is the statement “Medicis sales grew from $745M to $753M” possible because that’s what that table on the 2013 slide tells us.
The product that made up 50%+ of Medicis sales collapsed by $130M, another one went generic and somehow sales still managed to grow.
There simply wasn't any way Medicis could have made up the Solodyn collapse by growing another product. To me it’s really incredible to think that an analyst would have looked at that table and not questioned how those numbers made any sense. And yet they didn’t, at least not publicly as far as I can tell. So like I said earlier, in my mind, not having the Sanitas annual reports still doesn't absolve any analysts from being critical.
Alright, now a brief apology because I imagine many among you have had enough of those slides/tables and want to carry on with the analysis so I have to ask you to bear with me and understand that I wasn't kidding when I said that I saw a lot of people using those slides as proof of “how well the acquisitions are doing”, so I want to (figuratively) kill them once and for all with the hope that nobody will ever send them to me again.
So, with that in mind, one more thing.
Here’s something strange going on in those tables that I’m sure many of you noticed, (focus on the LTM prior to close columns):
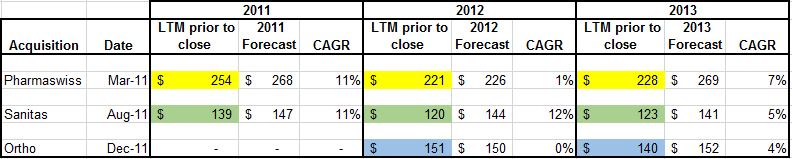
Pretty weird to see that trailing twelve months sales numbers PRIOR to the deals even closing are changing so much isn’t it? I think it’s awfully convenient to see that for instance as the 2012 Sanitas sales forecast is adjusted down to $144M from the previous year’s estimate of $147M, the trailing twelve months sales number BEFORE even acquiring the company is adjusted down by Valeant from $139M to $120M allowing them to show a nice (read fictional) 12% CAGR.
Let me first say that I think the idea behind those changes is that Valeant is adjusting for currency fluctuation to show the numbers on a “constant currency basis”. And that is not uncommon, most companies will do this as to show the growth/decline excluding fluctuations in exchange rates. However most companies do not go back and adjust historical numbers like this, they usually adjust the current period to reflect what the numbers would look like if the prior year exchange rates were maintained, but the answer shouldn’t be affected by that anyways. What is really striking is the magnitude of the changes, a drop from $254M to $221M is a pretty big one if the explanation is exchange rates only.
Of course, as always, our concern here should be whether or not there is a way for us to verify these changes. So, can we test these numbers? Well, the answer is a bit complicated in my opinion. It’s both yes and no.
Yes because if all we had to do is just test one currency then it would be easy to see if the change is reasonable or not. It’s as easy as knowing how to type www.oanda.com.
Take Pharmaswiss for example, knowing that the company operates mostly in the Euro zone and if we were to assume that they do most of their business in Euros then we could test the drop from $254M to $221M and see if we can get a number that is somewhat in the ballpark. It would only take a few steps:
- We know that Pharmaswiss was acquired in March 2011 and we’re told that the previous 12 months sales were $254M at the time.
- So we can go and get the average exchange rate between the Euro and the USD for March 2010 until March 2011 which would be 0.7553.
- From there we can convert back the $254M to the original amount in Euros, which would give us about EUR192M.
- Next step is to get the average exchange rate for the current period (that is first 3 quarters of 2012), which would be 0.7793, and then apply that to the EUR192M and the adjusted sales figure we’d get would be $246M. So the adjustment would have been to go from $254M to $246M instead of $254M to $221M, Which is a pretty big difference.
However, like I said earlier, it’s probably not that easy because Pharmaswiss operates in numerous countries and presumably currency adjustments involve more than the Euro so there really isn’t a way for us to know for sure. But again, what we can tell for a fact is that those adjustments are pretty drastic and opportunistic as far as helping mitigate a downward revision of estimated sales figures in dollar terms. This is another testament to how important 10-Ks are because if those numbers were presented in a 10-K as opposed to being a PowerPoint presentation then we’d all have more confidence in them.
As a matter of fact, let me take a brief moment and use my blog to run a public service announcement. Actually, let's call it an advertisement:
What I want to advertise is not a product nor a service. It’s a document. A document that everybody knows but unfortunately many people overlook. That document is the “10-K”, also called the annual report, cool kids just call it the “K”. You see folks, on top all the information they give us, like audited financial statements and stuff, there is a VERY important factor that makes the 10-K the single most important document in financial analysis. And that factor is that in countries like ours we have securities laws passed by Congress, which means that the entire U.S. Justice System stands behind that document. Put simply, those who lie in 10-Ks eventually end up in front of a judge explaining themselves.
If you think back to Part I, it’s no surprise that we had such a hard time finding numbers that would allow us to do our analysis like we wanted to. The Valeant folks aren’t crazy, they would never put in their 10-K that Sanitas made $147M in 2011 when they know very well that it was more like $125M. So what do they do instead? They give you those numbers in these nice presentations with the disclaimer that these are just “Estimates”. And estimates can be wrong, can’t they?
Actually, if you’re like me, there probably is something that made you uncomfortable as soon as you started reviewing those tables; if you go back to all three of them (one last time, I promise) and just focus on the headers you’ll see that there is something that is constantly missing. How often is it that you analyze a company that gives you the same information every year and yet they never give you an “Actual”? Every year we get an estimate coupled with a compounded growth rate based on that same estimate but never what the actual numbers were the previous year. I reckon we’d all be capable of computing CAGRs on our own if given actual numbers. Here’s a nice little quote to live by for all you analysts out there:
“Always be wary when management gives you growth numbers without giving you numbers!”
Before we move on to the next episode in our analysis, let me share with you the last straw as far as these slides are concerned. Some of you may be wondering why I haven’t shown you the 2014 tables. Well, in true Valeant fashion, that table is no more. I, for one, anxiously waited for the 2014 version of these tables in Q2, Q3, and Q4 to no avail. I really wanted to see what kind of numbers Valeant would cook up for us this year but they decided they had shown us enough, never mind that Mr. Pearson always introduced those tables by saying that they were part of an annual review of performance of their acquisitions that they present to the Board of Directors as well as shareholders.
I guess those tables are no longer part of the review then. Fair enough. It’s not like I really trusted them anyways.
So here’s my advice to all the people who have based themselves on these slides, and many other that we're yet to go over for that matter:
So here’s my advice to all the people who have based themselves on these slides, and many other that we're yet to go over for that matter:
- Please do yourselves a favor and stop.
- Throw them in the garbage, where they belong. You aren't learning anything from them at all. They’re just a way to legally mislead you. If Valeant wants us to take their numbers seriously my advice would be that they start including them in their 10-Ks.
Alright folks, for those of you still following, I have good and bad news. The bad news is that even though we've already covered quite a bit of ground, we still have a ways to go, we've barely scratched the surface believe it or not. However, the good news is that I think the next chapter in our Valeant journey will be the most important, so you have that to look forward to I guess.
You've certainly noticed that we haven't done anything other than try to confirm basic top line revenue numbers for the companies that Valeant acquires.
My goal in this first episode was simply to set the stage and show you what kind of animal we're dealing with in Valeant. I did that by pointing out how many red flags one can raise simply by trying to answer that simple and yet fundamental question about revenue because companies like Valeant that continuously make acquisitions can easily hide a lot of stuff as long as they keep acquiring bigger and bigger targets.
My goal in this first episode was simply to set the stage and show you what kind of animal we're dealing with in Valeant. I did that by pointing out how many red flags one can raise simply by trying to answer that simple and yet fundamental question about revenue because companies like Valeant that continuously make acquisitions can easily hide a lot of stuff as long as they keep acquiring bigger and bigger targets.
In our next installment, Part IV, we're going to cast a wider net and take on the whole Valeant story. All of it! (so be ready for it to be an even longer post)
We'll tackle valuation and their use of non-GAAP measures, we'll tackle claims they make about their products, claims they make about their returns and much more. As a reminder, here's the outline of what is coming up next:
They've built a whole fantasy about how exceptional they are and it is time it stopped before investors get really hurt.
PART IV: Unpacking the Valeant Story
- The Cash Earnings Fallacy
- The Durability Fallacy
- Medicis Case Study
- The IRR Fallacy, the Stuff Crooks Are Made Of and the Synergy Conundrum
- Murky Accounting and Warren Buffett's Cockroach Principle
- Delusion of Grandeur and The Expert Fallacy
They've built a whole fantasy about how exceptional they are and it is time it stopped before investors get really hurt.
Until next time, please be careful everybody and I bid you all good investing.
AZ Value

